ET monogram

Drawing set · Portfolio · Rev. Nov 2026

Ebru TiminciProduct designer · trained as an architect

I research how people feel, draw the flow in Figma, and build it in code.

Fall in love with the problem, not the solution.

Scale: 4 sheets · 1 drawing set
Legend · my method PlanResearchSynthesizeDesignBuild
PlanResearchSynthesizeDesignBuild

UX Research App

A tool that helps founders turn an idea into hypotheses, interview guides and surveys. While you write a question, it flags the ones that will get you polite answers instead of true ones. It follows my own research rule: ask about the past, never "would you use…".

Example

Would you use an app that reminds you to drink water?

Future question · yes/no question

Tell me about the last time you forgot to drink water during a workday.

I wrote the product spec, designed the flow and built it in plain JavaScript, deployed on Vercel. I used it to run a survey study and rank the insights.

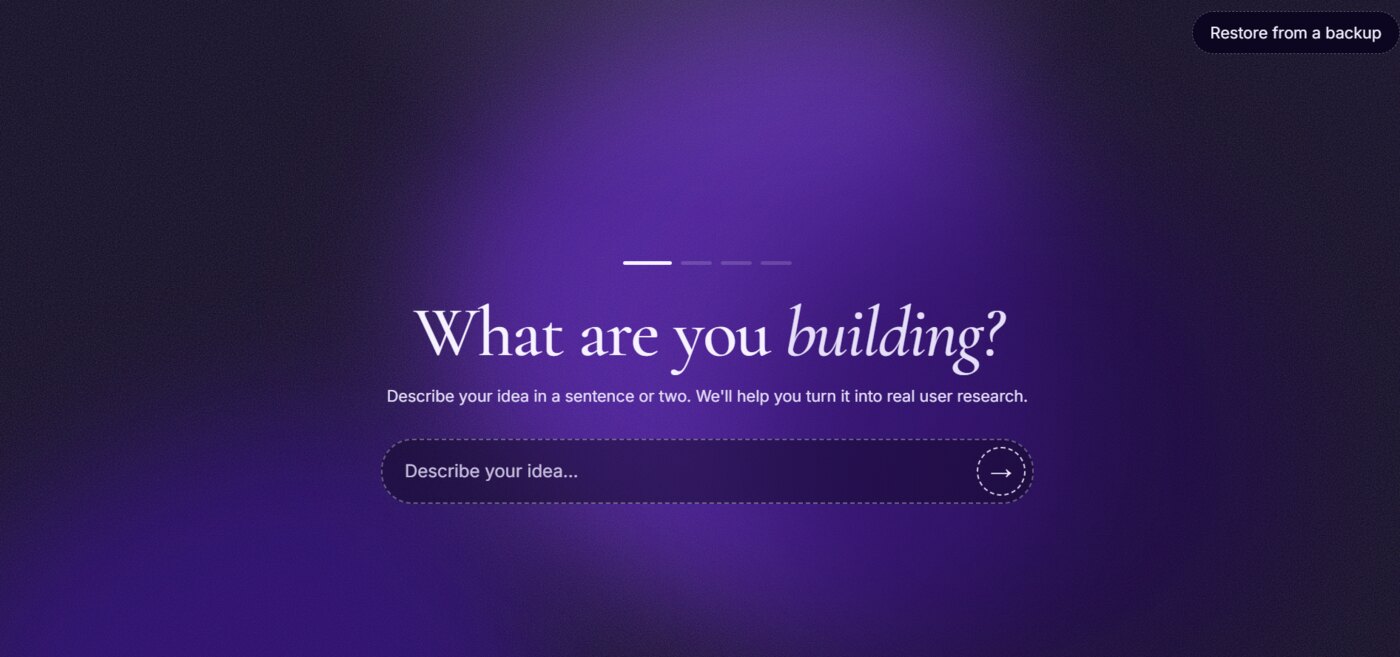
The app's start screen: What are you building? above a single input
Viewport 1:1. One sentence in, real research out.
Open the full sheet → Try it live →
PlanResearchSynthesizeDesignBuild

LPP bus widget

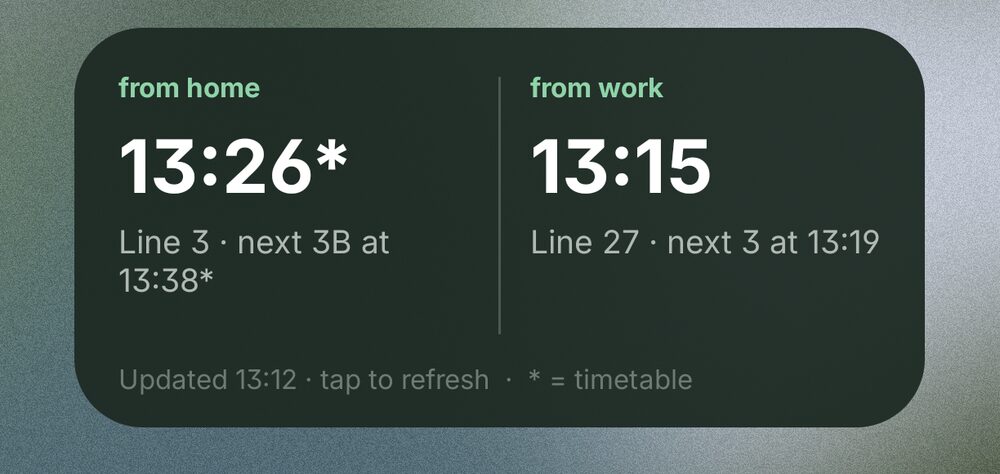
The next bus from home and from work, right on the phone's home screen, so I never open an app at the stop. A star marks a timetable time, so it can't be mistaken for live GPS.

Android home-screen widget showing the next bus from home at 13:26 (timetable) and from work at 13:15, with the next departures below
Viewport 1:1. Two stops, one glance. "* = timetable" sits in the footer, and a short survey tests whether people notice it.
View the code on GitHub →
PlanResearchSynthesizeDesignBuild

Feeling at Home in the City

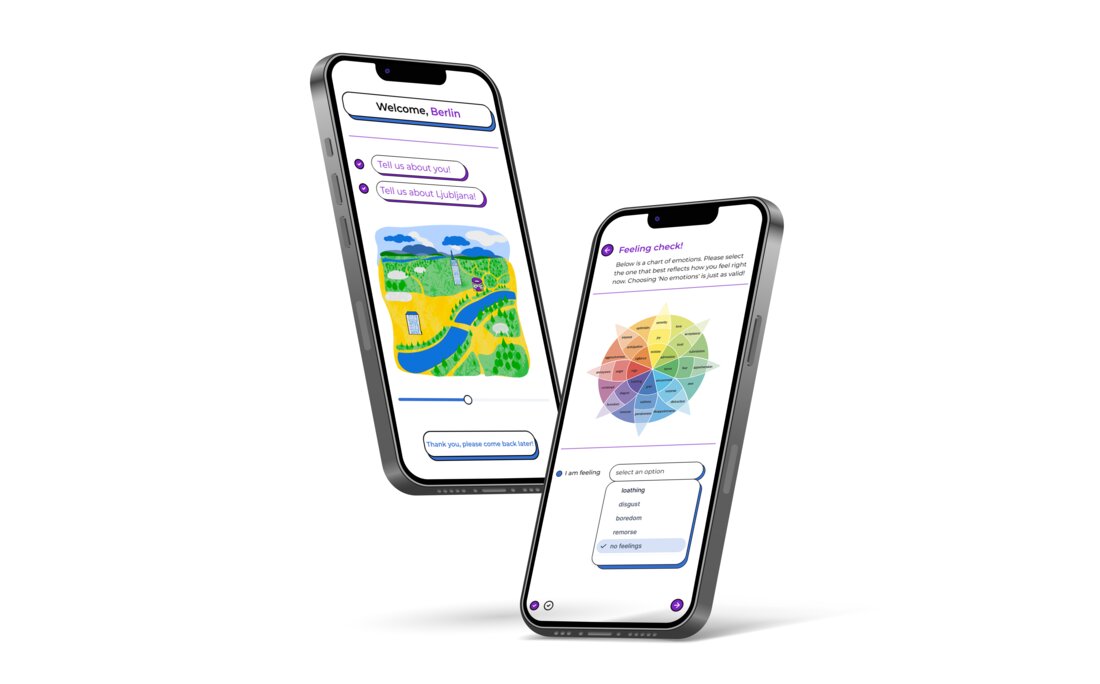
How do people feel in Ljubljana's streets, and does it change with who they are? For my master's thesis I designed an experience-sampling app: two short surveys, then daily check-ins, with an illustrated city that grows as people take part. 31 people took part, sending 98 check-ins tagged with where they were, which I mapped in QGIS.

Two phone screens: a welcome screen with an illustrated map of Ljubljana, and a feeling check with an emotion wheel
Viewport A. Welcome screen and the daily feeling check.
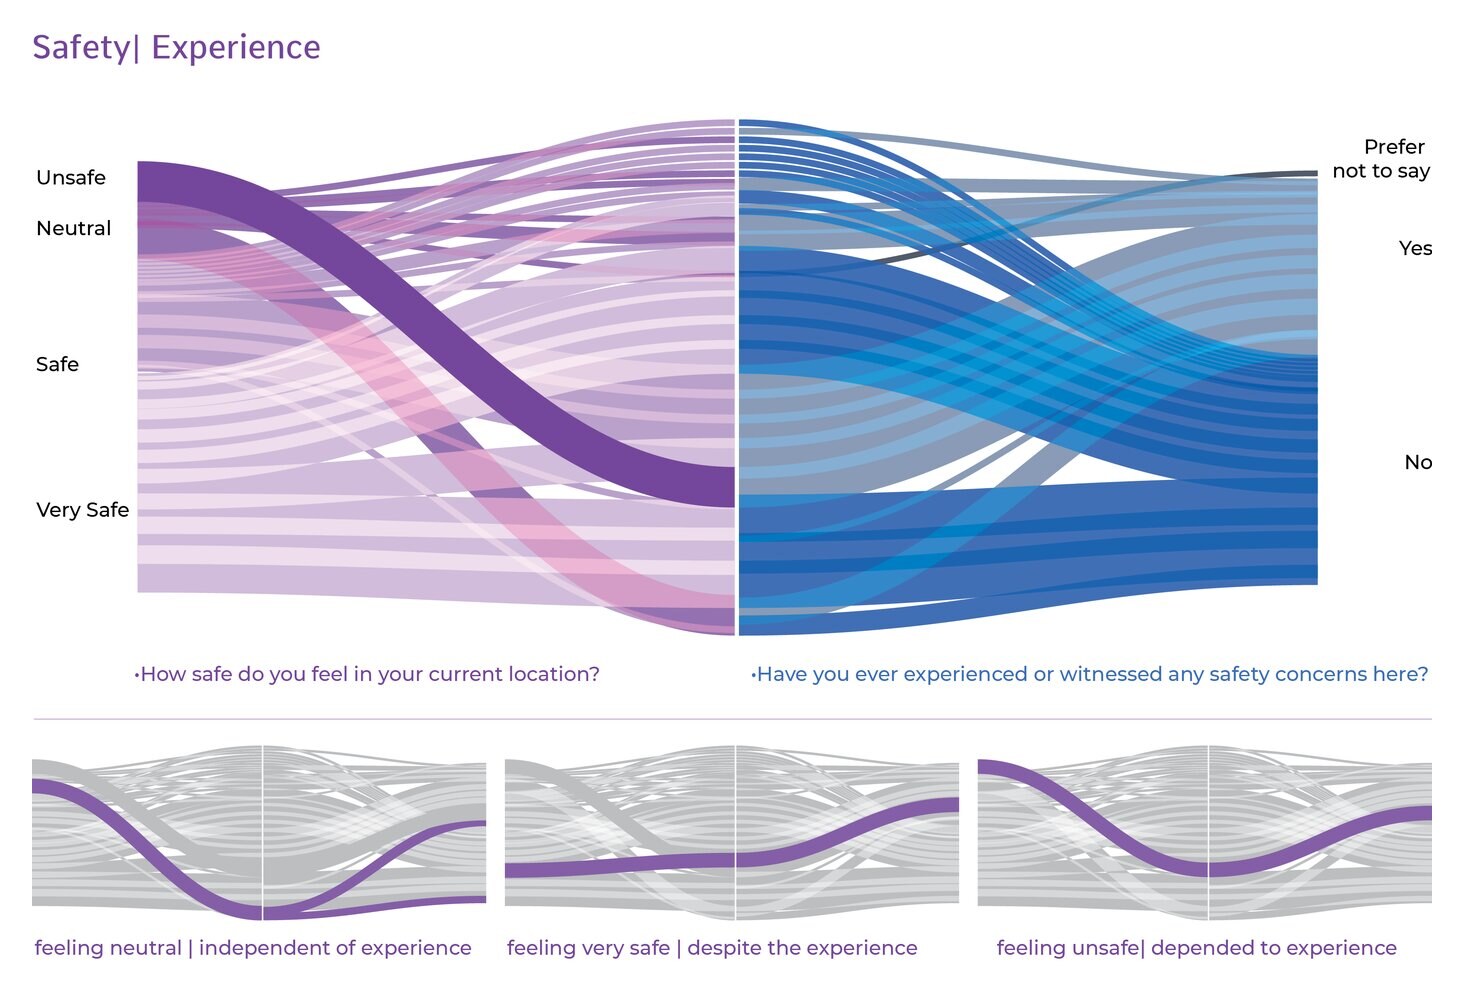
Flow diagram linking how safe people feel in their location to whether they have experienced safety concerns there
Viewport B. How feeling safe connects to what people have lived through.
Open the full research sheet →

General notes

From buildings to products

Architecture taught me to design for people who live with my decisions every day, and to care about grids, scale and typography. A psychology minor taught me to ask why people behave the way they do. I bring both to digital products, and I prototype in code so I can test ideas with real people sooner.